Project Overview
This project aims to use machine learning models LightGBM and XGBoost for predicting the target value of insurance premiums, leveraging a dataset with demographic, lifestyle, and policy details to identify key factors influencing premium amounts. The project was a part of a competition hosted on Kaggle in December 2024, aimed for participants to build a prediction model with the lowest Root Mean Square Log Error (RMSLE). There were 2,390 participants with their best RMSLE ranging from 1.01706 (lowest) to 6.68302 (highest). My score is 1.08439.
Python code for the project
The data for this project is available here, on the Kaggle competitions page. Follow the instruction in the dataset description to acquire the data.
# Importing all the libraries needed
        import pandas as pd, numpy as np, seaborn as sns, matplotlib.pyplot as plt
        from sklearn.impute import SimpleImputer
        from sklearn.preprocessing import OneHotEncoder, StandardScaler
        from sklearn.compose import ColumnTransformer
        from sklearn.pipeline import Pipeline
        from xgboost import XGBRegressor
        import xgboost as xgb
        from lightgbm import LGBMRegressor
        from sklearn.metrics import root_mean_squared_log_error
        from sklearn.model_selection import train_test_split, GridSearchCV

        # Set dataframe display options
        pd.set_option('display.max_rows', 500)
        pd.set_option('display.max_columns', None)
        pd.set_option('display.float_format', '{:.2f}'.format)


# Import both test and train data
train_df = pd.read_csv('train.csv')
test_df = pd.read_csv('test.csv')

# Check how many rows

print(f'Train row count: {train_df.shape[0]}')
print(f'Test row count: {test_df.shape[0]}')
train_df.columns

# Add a differentiator column for when we merge test and train data
train_df['Dataset'] = 'train'
test_df['Dataset'] = 'test'

# Merge test and train data
df = pd.concat([train_df,test_df])

print,(df.shape)
df.head(2)

Data Visualization and Analysis
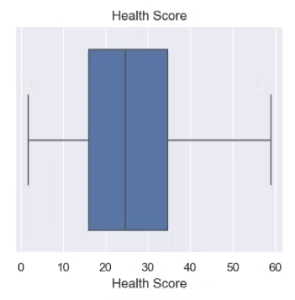
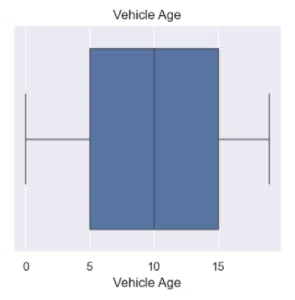
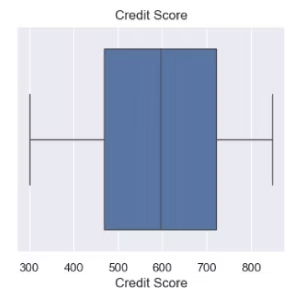
Let’s first visualize the numeric data, and see where (if) there are outliers:
sns.set(rc = {'figure.figsize':(15,15)})
fig, ((ax1, ax2, ax3),(ax4, ax5, ax6),(ax7, ax8, ax9)) = plt.subplots(nrows=3, ncols=3)

sns.boxplot(x=df['Age'], ax=ax1).set(title='Age')
sns.boxplot(x=df['Annual Income'], ax=ax2).set(title='Annual Income')
sns.boxplot(x=df['Number of Dependents'], ax=ax3).set(title='Number of dependents')

sns.boxplot(x=df['Health Score'], ax=ax4).set(title='Health Score')
sns.boxplot(x=df['Previous Claims'], ax=ax5).set(title='Previous Claims')
sns.boxplot(x=df['Vehicle Age'], ax=ax6).set(title='Vehicle Age')

sns.boxplot(x=df['Credit Score'], ax=ax7).set(title='Credit Score')
sns.boxplot(x=df['Insurance Duration'], ax=ax8).set(title='Insurance Duration')
sns.boxplot(x=df.loc[df['Dataset']=='train']['Premium Amount'], ax=ax9).set(title='Premium Amount')

incomeQ1, incomeQ3, incomeIQR = df['Annual Income'].quantile(0.25), df['Annual Income'].quantile(0.75), (df['Annual Income'].quantile(0.75) - df['Annual Income'].quantile(0.25))
incomeUpperBound, incomeLowerBound = (incomeQ3+(incomeIQR*1.5)), (incomeQ1-(incomeIQR*1.5))
ax2.axvline(incomeUpperBound, dashes=(2, 2))

claimsQ1, claimsQ3, claimsIQR = df['Previous Claims'].quantile(0.25), df['Previous Claims'].quantile(0.75), (df['Previous Claims'].quantile(0.75) - df['Previous Claims'].quantile(0.25))
claimsUpperBound, claimsLowerBound = (claimsQ3+(claimsIQR*1.5)), (claimsQ1-(incomeIQR*1.5))
ax5.axvline(claimsUpperBound, dashes=(2, 2))

premium_train = df.loc[df['Dataset']=='train']['Premium Amount']
premiumQ1, premiumQ3, premiumIQR = premium_train.quantile(0.25), premium_train.quantile(0.75), (premium_train.quantile(0.75) - premium_train.quantile(0.25))
premiumUpperBound, premiumLowerBound = (premiumQ3+(premiumIQR*1.5)), (premiumQ1-(premiumIQR*1.5))
ax9.axvline(premiumUpperBound, dashes=(2, 2))

plt.subplots_adjust(hspace = 0.5);
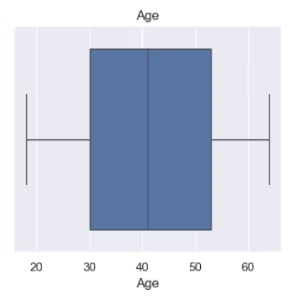
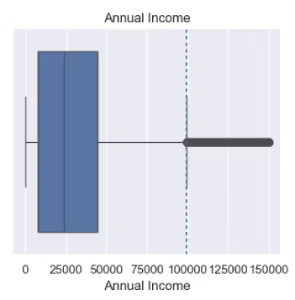
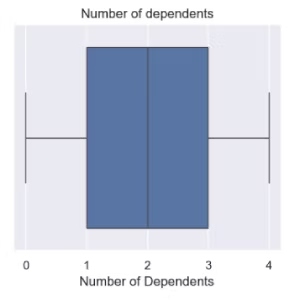
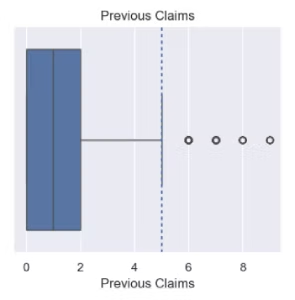
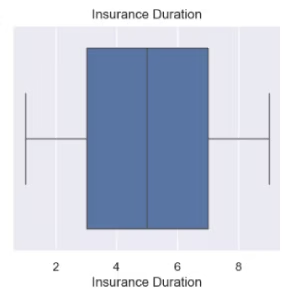
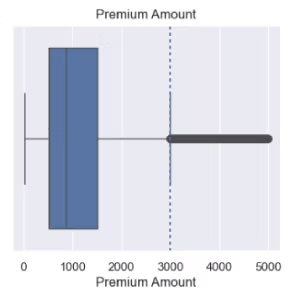
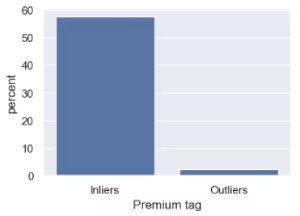
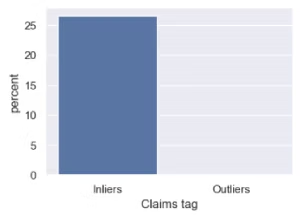
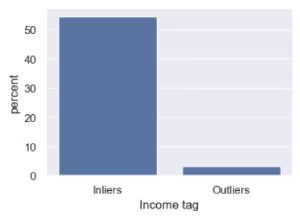
Let’s review the ratio of outlier to inlier data for the three feature having outliers in the boxplots:
df['Premium tag'] = pd.cut(df.loc[df['Dataset']=='train']['Premium Amount'], bins=[0, 3000, 5500], labels=['Inliers', 'Outliers'])
df['Claims tag'] = pd.cut(df.loc[df['Dataset']=='train']['Previous Claims'], bins=[0, 5, 9], labels=['Inliers', 'Outliers'])
df['Income tag'] = pd.cut(df.loc[df['Dataset']=='train']['Annual Income'], bins=[0, 100000, 150000], labels=['Inliers', 'Outliers'])

sns.set(rc = {'figure.figsize':(15,3)})
fig, axs = plt.subplots(ncols=3)
sns.countplot(data=df, x='Premium tag', ax=axs[0], stat="percent")
sns.countplot(data=df, x='Claims tag', ax=axs[1], stat="percent")
sns.countplot(data=df, x='Income tag', ax=axs[2], stat="percent");
num_data = train_df[['Age','Annual Income','Number of Dependents','Health Score','Previous Claims','Vehicle Age','Credit Score','Insurance Duration','Premium Amount']]
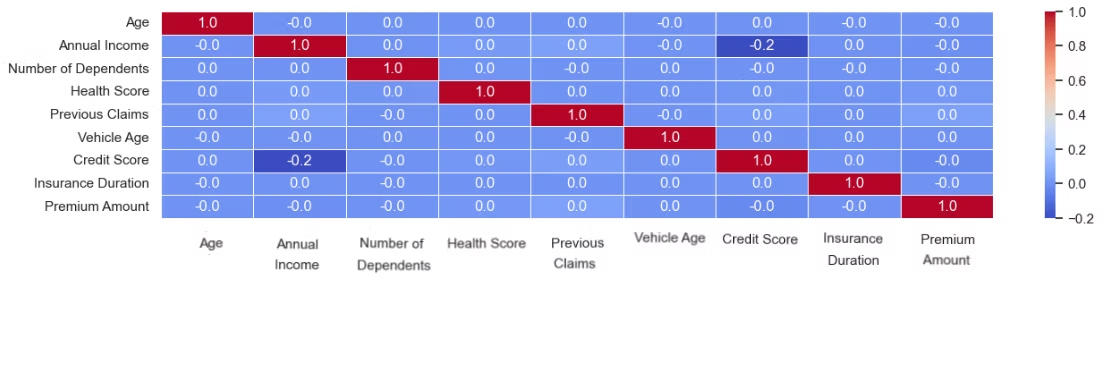
sns.heatmap(num_data.corr(), annot=True, cmap='coolwarm', fmt='.1f', linewidths=0.5);
Data Preprocessing
Lets create some new data points and bucket groups
df['Policy Start Date'] = pd.to_datetime(df['Policy Start Date'], format='%Y-%m-%d %H:%M:%S.%f')
df['start_year'] = df['Policy Start Date'].dt.year
df['start_qtr'] = df['Policy Start Date'].dt.quarter
df['start_month'] = df['Policy Start Date'].dt.month
df['start_day'] = df['Policy Start Date'].dt.dayofweek

df['AgeSegment']  = pd.cut(df['Age'],[17,25,40,55,64], labels=['Young Adults','Adults','Middle Aged','Near Retirement'])
df['PremiumSegment'] = pd.cut(df['Premium Amount'], bins=[0, 500, 1000, 1500, 2000, 2500, 3000, 5000], labels=['Very Low', 'Low', 'Around Avg', 'Above Avg', 'High', 'Very High', 'Outlier'])
df['IncomeSegment']  = pd.cut(df['Annual Income'],[0,10000,25000,60000,100000,150000], labels=['Very Low Income','Low Income','Mid Income','High Income','Very High Income'])
df['HealthScoreSegment']  = pd.cut(df['Health Score'],[1,15,30,45,60], labels=['Very Low','Low','Mid','High'])
df['VehicleAgeSegment']  = pd.cut(df['Vehicle Age'],[-0.1,1,5,10,15,19], labels=['New','Fairly Used','Morderately Used','Well Used','Old'])
df['CreditScoreSegment']  = pd.cut(df['Credit Score'],[299,580,670,740,800,850], labels=['Poor','Fair','Good','Very good','Exceptional'])
df['InsuranceDurationSegment']  = pd.cut(df['Insurance Duration'],[0,3,5,7,9], labels=['New','Loyal','Established','Long-term'])

df.head(1)

Make the train test split and encode the categorical and numerical columns/features.
Split the training dataset into the target y data and the features X data. Due to the data columns not having any notable correlations – as seen from Data analysis and Viz, I’ll be using all the columns, except the index columns
X = df[df['Dataset']=='train'].drop(columns=['Premium Amount','id','index','Dataset'])
y = df[df['Dataset']=='train']['Premium Amount']

# Spliting the data using 80/20 split ratio
X_train, X_test, y_train, y_test = train_test_split(X, y, test_size=0.2, random_state=42)

# Further split the X train data by data types so we can encode them properly in our ML pipeline
## For numerical columns, i've used scaling to encode numeric data by their column mean and one hot encoder for the categorical columns

numerical_cols = X_train.select_dtypes(include=["float64", "int64"]).columns
categorical_cols = X_train.select_dtypes(include=["object"]).columns

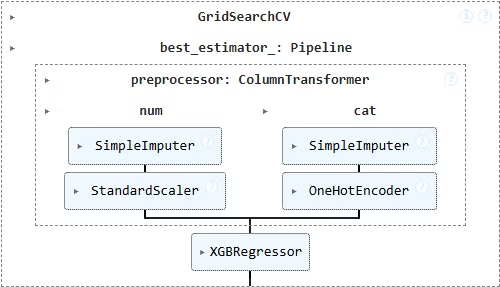
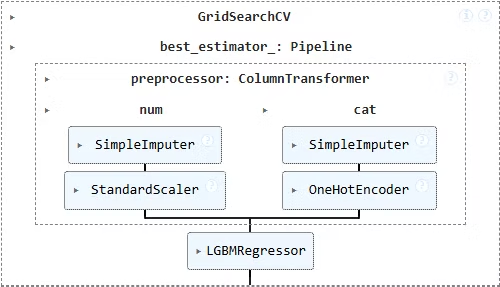
numerical_transformer = Pipeline(steps=[("imputer", SimpleImputer(strategy="mean")), ("scaler", StandardScaler())])

categorical_transformer = Pipeline(steps=[("imputer", SimpleImputer(strategy="most_frequent")), ("onehot", OneHotEncoder(handle_unknown="ignore"))])

preprocessor = ColumnTransformer(transformers=[("num", numerical_transformer, numerical_cols), ("cat", categorical_transformer, categorical_cols)])
Model Development
# I'll be using the XGBoost and LightGBM models
## LightGBM: Speed and efficiency with large datasets like this one
### XGBoost: Efficient and can be better improved with tuning

lgbm_model = Pipeline(steps=[("preprocessor", preprocessor), ("model", LGBMRegressor(eval_metric='rmsle', verbosity=-1, random_state=42))])

xgb_model = Pipeline(steps=[("preprocessor", preprocessor), ("model", XGBRegressor(eval_metric='rmsle', verbosity=2, random_state=42))])

lgbm_model.fit(X_train, y_train)
y_pred = lgbm_model.predict(X_test)
lgbm_rmsle = root_mean_squared_log_error(y_test, y_pred)
print(f'LightGBM Root Mean Squared Logarithmic Error: {lgbm_rmsle}\n')

xgb_model.fit(X_train, y_train)
y_pred = xgb_model.predict(X_test)
xgb_rmsle = root_mean_squared_log_error(y_test, y_pred)
print(f'XGBoost Root Mean Squared Logarithmic Error: {xgb_rmsle}\n')

- The LightGBM model performed better among the base models
Hyper-tuning
xgb_param_grid = {'model__n_estimators': [50, 100, 200], 'model__learning_rate': [0.01, 0.1, 0.2], 'model__max_depth': [10, 20, None], 'model__objective': ['reg:squaredlogerror']}
xgb_grid = GridSearchCV(estimator = xgb_model, param_grid=xgb_param_grid, scoring='neg_root_mean_squared_log_error')
xgb_grid.fit(X_train, y_train)

lgbm_param_grid = {'model__n_estimators': [100, 200, 500], 'model__max_depth': [5, 10, None], 'model__objective': ['root_mean_squared_error']}
lgbm_grid = GridSearchCV(estimator = lgbm_model, param_grid=lgbm_param_grid, scoring='neg_root_mean_squared_log_error')
lgbm_grid.fit(X_train, y_train)

best_lgbm_model = lgbm_grid.best_estimator_
y_pred_best_lgbm = best_lgbm_model.predict(X_test)
best_lgbm_rmsle = root_mean_squared_log_error(y_test, y_pred_best_lgbm)
print(f"Best Root Mean Squared Logarithmic Error (RMSLE) for LightGBM: {best_lgbm_rmsle},\nBest LightGBM Parameters: {lgbm_grid.best_params_}\n\n")

best_xgb_model = xgb_grid.best_estimator_
y_pred_best_xgb = best_xgb_model.predict(X_test)
best_xgb_rmsle = root_mean_squared_log_error(y_test, y_pred_best_xgb)
print(f"Best Root Mean Squared Logarithmic Error (RMSLE) for XGBoost: {best_xgb_rmsle},\nBest XGBoost Parameters: {xgb_grid.best_params_}")

print(f'LGBM improvement = {best_lgbm_rmsle - lgbm_rmsle}')
print(f'XGBoost improvement = {best_xgb_rmsle - xgb_rmsle}')


Slight improvement for LGBM, but XGBoost tuned up to perform better
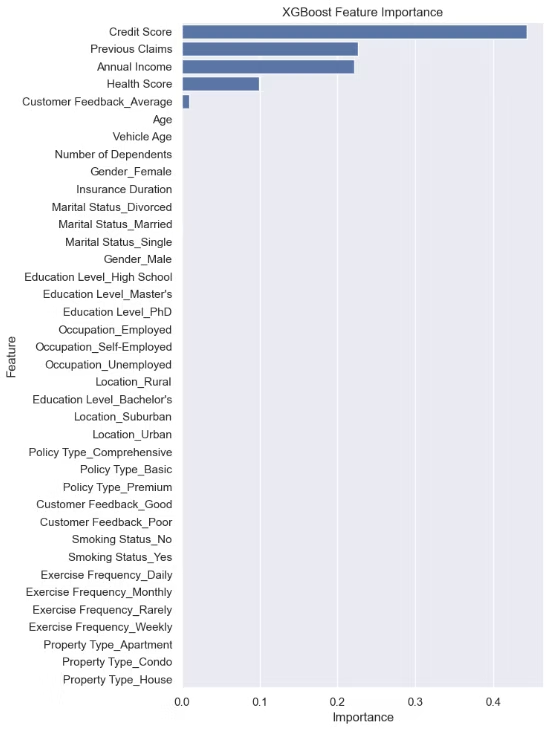
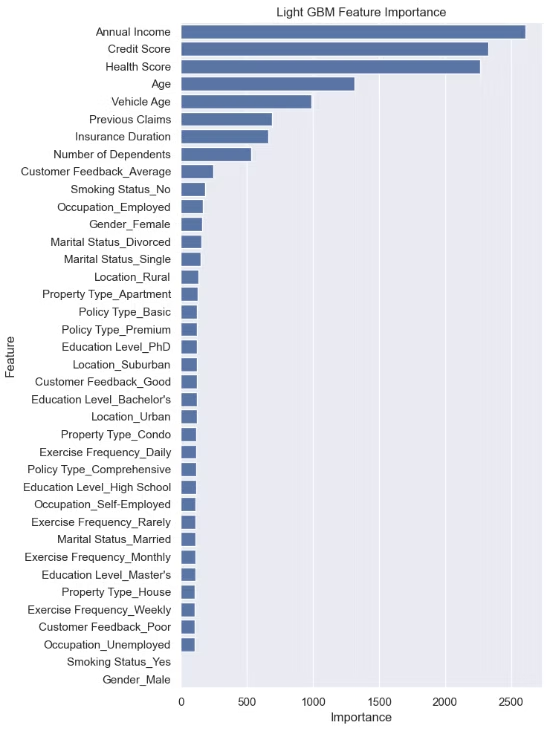
Review key features influencing how premiums are set
lgbm_preprocessor = best_lgbm_model.named_steps["preprocessor"]
lgbm_onehot_encoder_cat = lgbm_preprocessor.transformers_[1][1].named_steps["onehot"]
lgbm_scaler_encoder_num = lgbm_preprocessor.transformers_[0][1].named_steps["scaler"]

lgbm_categorical_features = lgbm_onehot_encoder_cat.get_feature_names_out(categorical_cols)
lgbm_numerical_features = lgbm_scaler_encoder_num.get_feature_names_out(numerical_cols)

lgbm_feature_names = np.concatenate([lgbm_numerical_features, lgbm_categorical_features])
lgbm_feature_importances = best_lgbm_model.named_steps["model"].feature_importances_
lgbm_feature_importance_df = pd.DataFrame({"Feature": lgbm_feature_names, "Importance": lgbm_feature_importances}).sort_values(by="Importance", ascending=False)


xgb_preprocessor = best_xgb_model.named_steps["preprocessor"]
xgb_onehot_encoder_cat = xgb_preprocessor.transformers_[1][1].named_steps["onehot"]
xgb_scaler_encoder_num = xgb_preprocessor.transformers_[0][1].named_steps["scaler"]

xgb_categorical_features = xgb_onehot_encoder_cat.get_feature_names_out(categorical_cols)
xgb_numerical_features = xgb_scaler_encoder_num.get_feature_names_out(numerical_cols)

xgb_feature_names = np.concatenate([xgb_numerical_features, xgb_categorical_features])
xgb_feature_importances = best_xgb_model.named_steps["model"].feature_importances_
xgb_feature_importance_df = pd.DataFrame({"Feature": xgb_feature_names, "Importance": xgb_feature_importances}).sort_values(by="Importance", ascending=False)

sns.set(rc = {'figure.figsize':(15,10)})
fig, axs = plt.subplots(ncols=2)
sns.barplot(data=lgbm_feature_importance_df, y='Feature', x='Importance', ax=axs[1]).set(title='Light GBM Feature Importance')
sns.barplot(data=xgb_feature_importance_df, y='Feature', x='Importance', ax=axs[0]).set(title='XGBoost Feature Importance')
plt.tight_layout();
testing_df = df[df['Dataset']=='test']
testing_df_for_prediction = testing_df.drop(columns=['Premium Amount','id','Dataset'])
xgb_output = best_xgb_model.predict(testing_df_for_prediction)

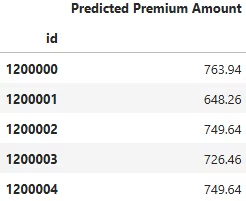
submission = pd.DataFrame({'id': testing_df.index, 'Predicted Premium Amount': xgb_output}).set_index('id')
submission.to_csv("submission_20241230_RMSLE_1.0838731114904818.csv")

# Review top 5 predicted rows
submission.head()
Email: s.o@sesandatalab.com
© 2024 Sesan Data Lab